
March 2026 brought a cautiously active Toronto real estate market — one defined less by momentum than by selective buyer confidence. After a subdued winter, spring listings arrived with force, but demand remained uneven. Buyers in the freehold segment showed renewed conviction for well-priced, move-in-ready homes in the core, while the condo market continued to grapple with elevated inventory and pricing pressure driven by a surge in investor-owned units returning to market.
Below is a detailed breakdown of both the condo and freehold markets in the Toronto core (C01–C12 districts), covering the key indicators you need to understand where the market truly stands heading into the spring season.
Condo Market — Toronto Core
The Toronto core condo market in March 2026 remained firmly in buyer's territory. A significant increase in new listings relative to sales kept conditions soft, and the benchmark price continued its gradual correction that began in mid-2025. That said, the rate of price decline has slowed — a signal worth watching as we move into the traditionally stronger April and May window.
Sales-to-New-Listings Ratio (SNLR)
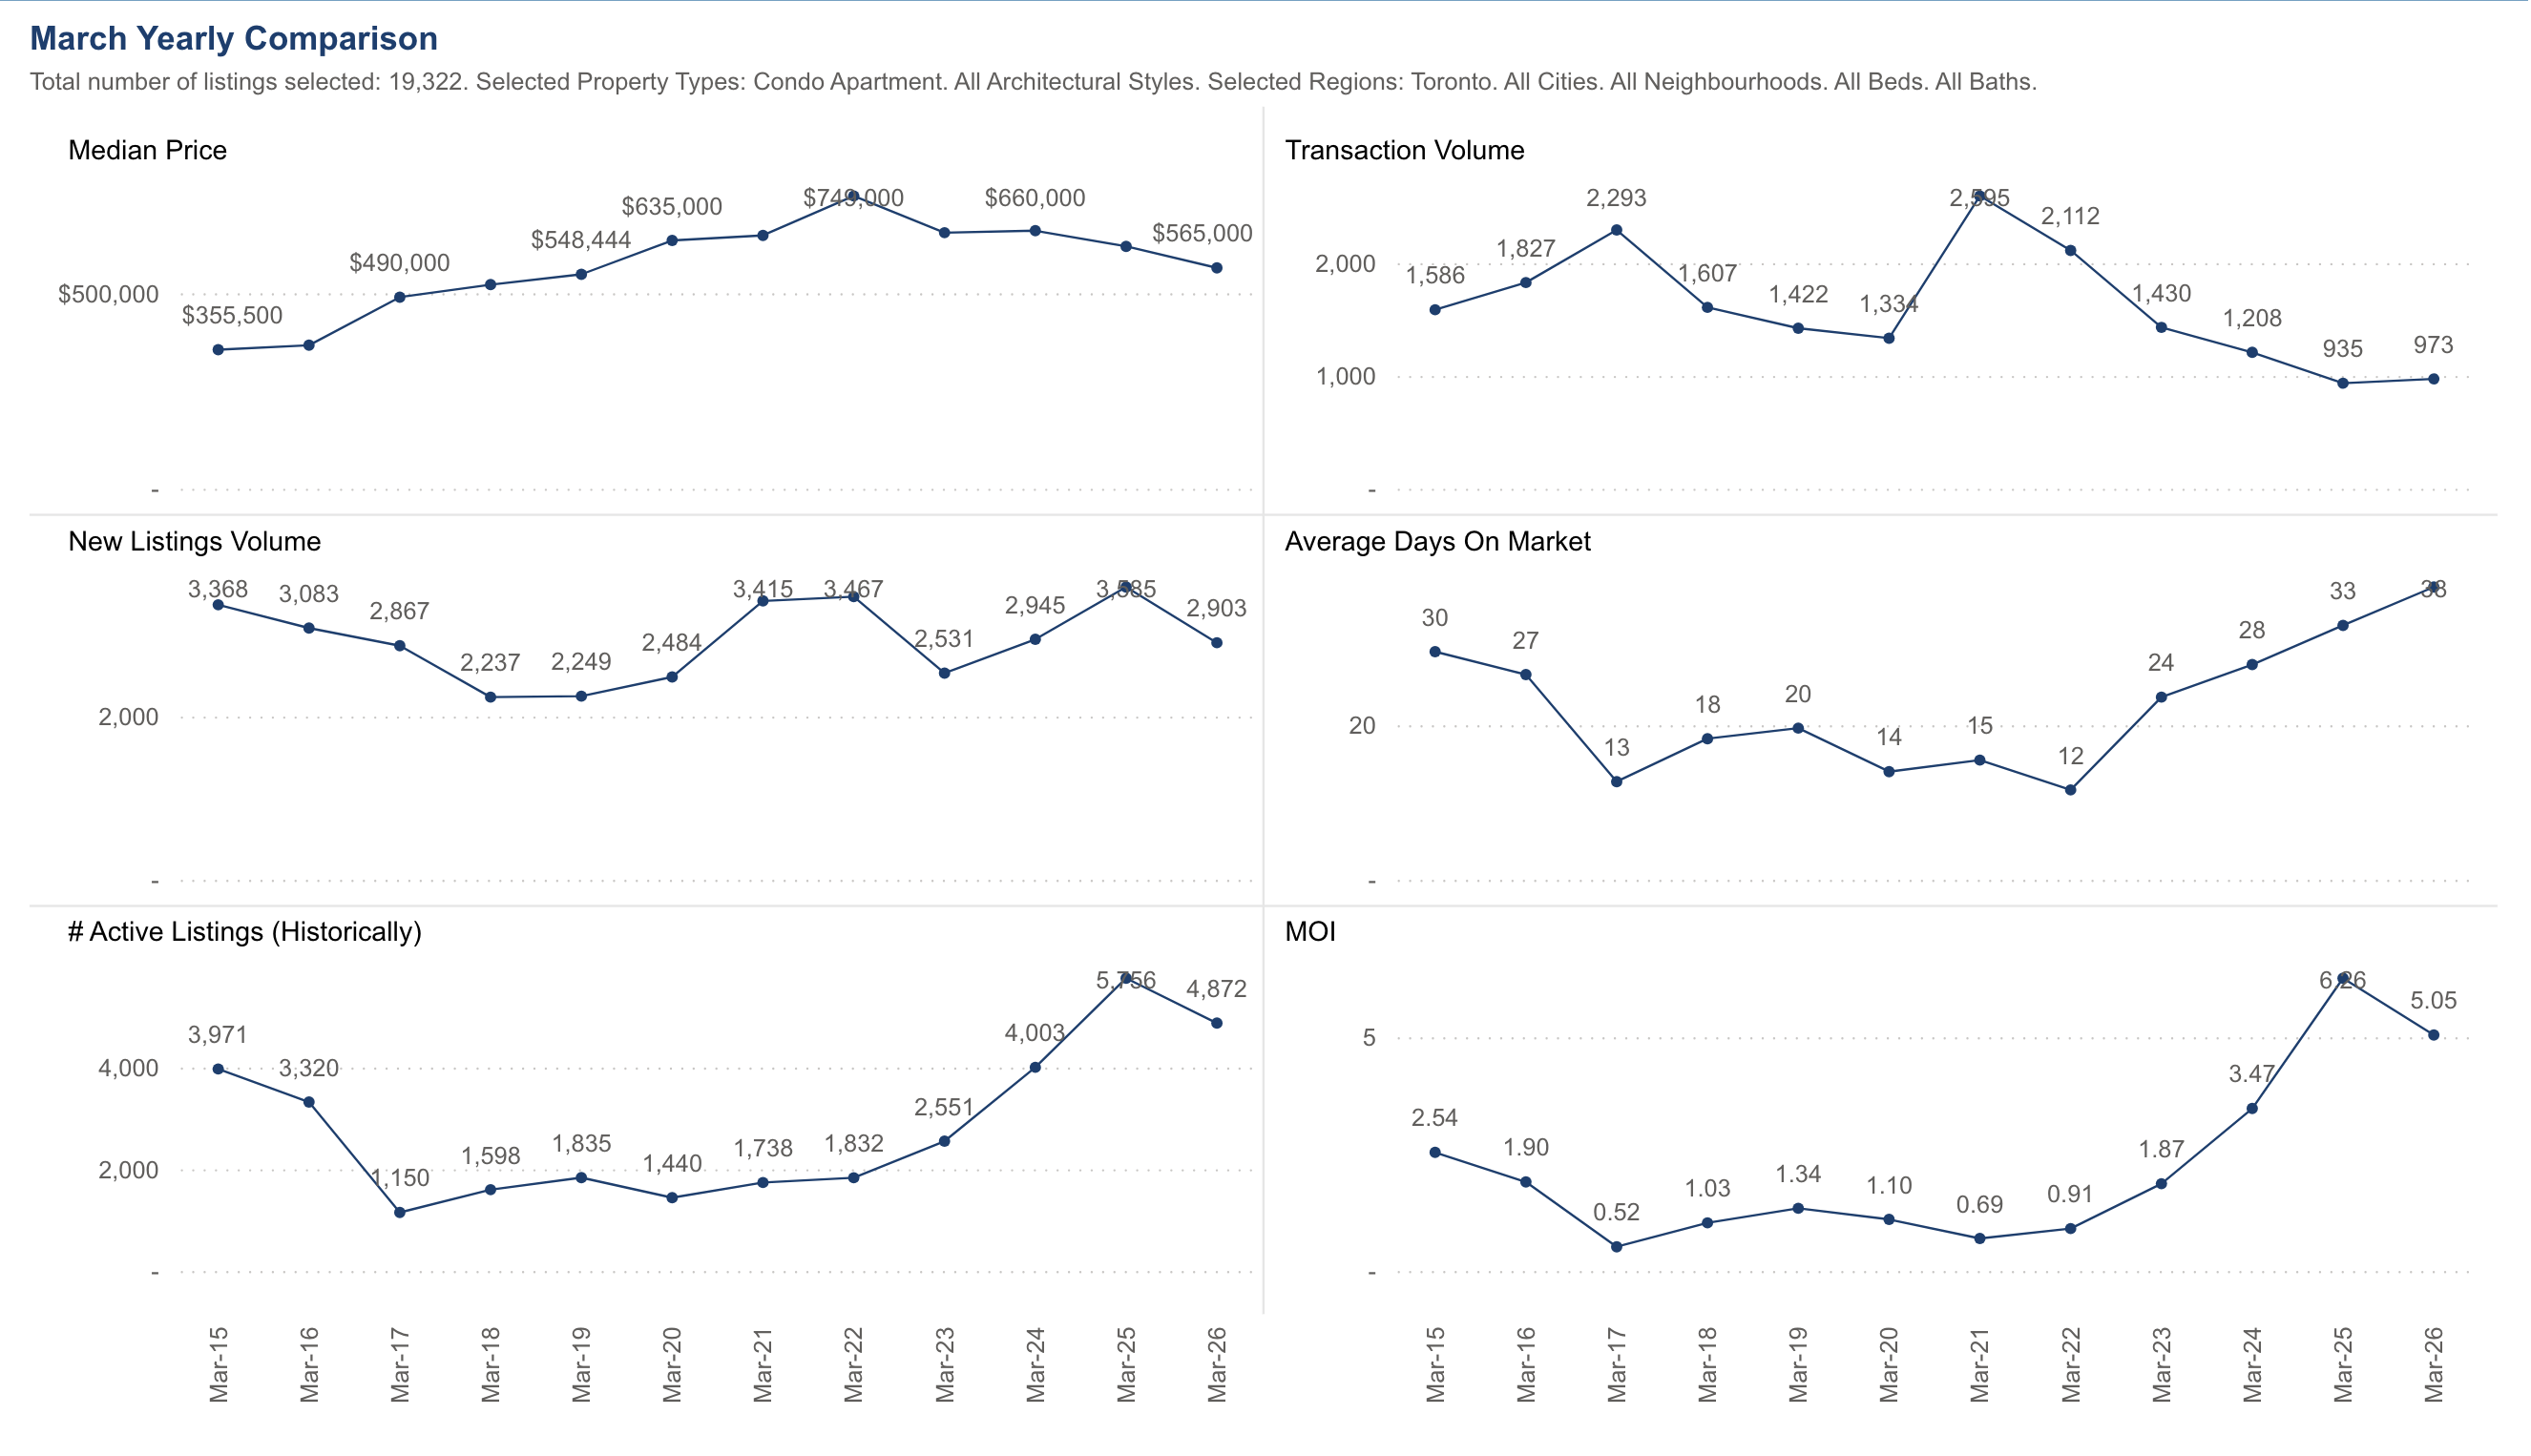
With 973 sales against 2,903 new listings, the condo SNLR sits at 33.5% — firmly in buyer's market territory. A ratio below 40% gives buyers negotiating leverage on price and conditions, and at 33.5% that leverage is real. To put the current environment in context: at the March 2022 peak, transaction volume reached 2,995 sales. Today's 973 sales represents less than a third of that activity. Sellers who price at 2022 or 2024 values are sitting unsold, while condos priced at or below current market value are still trading within a reasonable timeframe.
Months of Inventory
At 5.05 months of inventory — with 4,872 active listings on the market — the condo segment has the most supply it has seen in over a decade of March readings. For context, MOI hit a historic low of just 0.52 months in March 2017 at the peak of that cycle. The climb back up since March 2022 (0.69 months) to today's 5.05 months is one of the starkest reversals in recent Toronto real estate history. Any reading above 4 months is a buyer's market; at 5.05 months, buyers have genuine choice and sellers have genuine competition.

Toronto core condo towers, including the Yonge & Bloor corridor. Photo: March 2026.
Median Price — Condos
The median sale price for condo apartments in Toronto came in at $565,000 in March 2026 — down from $660,000 in March 2025 and well below the $745,000 peak recorded in March 2022. That is a 24% correction from peak over four years. The chart below shows the full historical picture: prices climbed steadily from $355,500 in March 2015 to the $745,000 peak, and have been unwinding since. The pace of decline has moderated compared to 2023–2024, but with MOI still rising and DOM now at 36 days, the floor has not yet been clearly established.
Source: TRREB data. March yearly comparison — Condo Apartment, Toronto. All figures current as of March 2026.
| Condo Type | Est. Median (Mar 2026) | Est. Median (Mar 2025) | Avg. DOM |
|---|---|---|---|
| Studio / Bachelor | ~$420,000 | ~$475,000 | 40 days |
| 1 Bedroom | ~$530,000 | ~$610,000 | 36 days |
| 1 Bed + Den | ~$590,000 | ~$665,000 | 34 days |
| 2 Bedroom | ~$720,000 | ~$790,000 | 30 days |
| 2 Bed + Den / 3 Bed | ~$860,000 | ~$920,000 | 26 days |
Estimated ranges derived from TRREB condo apartment median of $565,000 (Mar 2026) and $660,000 (Mar 2025). Individual results vary by building, floor, and finish.
Freehold Residential Market — Toronto Core
The freehold market — encompassing detached, semi-detached, and townhomes in the Toronto core — painted a notably different picture from the condo segment in March 2026. While still technically a buyer's market by ratio, freehold properties in established neighbourhoods such as Leaside, Rosedale, Forest Hill, Leslieville, and Trinity-Bellwoods showed genuine competition, particularly for turnkey homes in the $1.2M–$1.8M range.
Sales-to-New-Listings Ratio (SNLR)
With 762 sales against 1,906 new listings, the freehold SNLR landed at 40% in March 2026 — sitting right at the lower edge of balanced market territory. This is a meaningful step down from the 56% recorded in March 2021 at the peak, and below the 46% seen in March 2024. It reflects a market where buyers have regained negotiating power after years of seller dominance, yet well-presented, well-priced freehold homes in the core are still attracting serious interest.
Months of Inventory
At 3.31 months, freehold inventory is at its highest March reading in over a decade — up from 3.12 in March 2025 and a dramatic reversal from the 0.71 months seen at the March 2022 peak. Active listings sitting at 2,482 means buyers have genuine choice, and sellers can no longer rely on scarcity to drive bids. The trend line since 2022 has been a steady climb in inventory, and March 2026 continues that pattern. A reading above 4 months would tip fully into buyer's market territory.
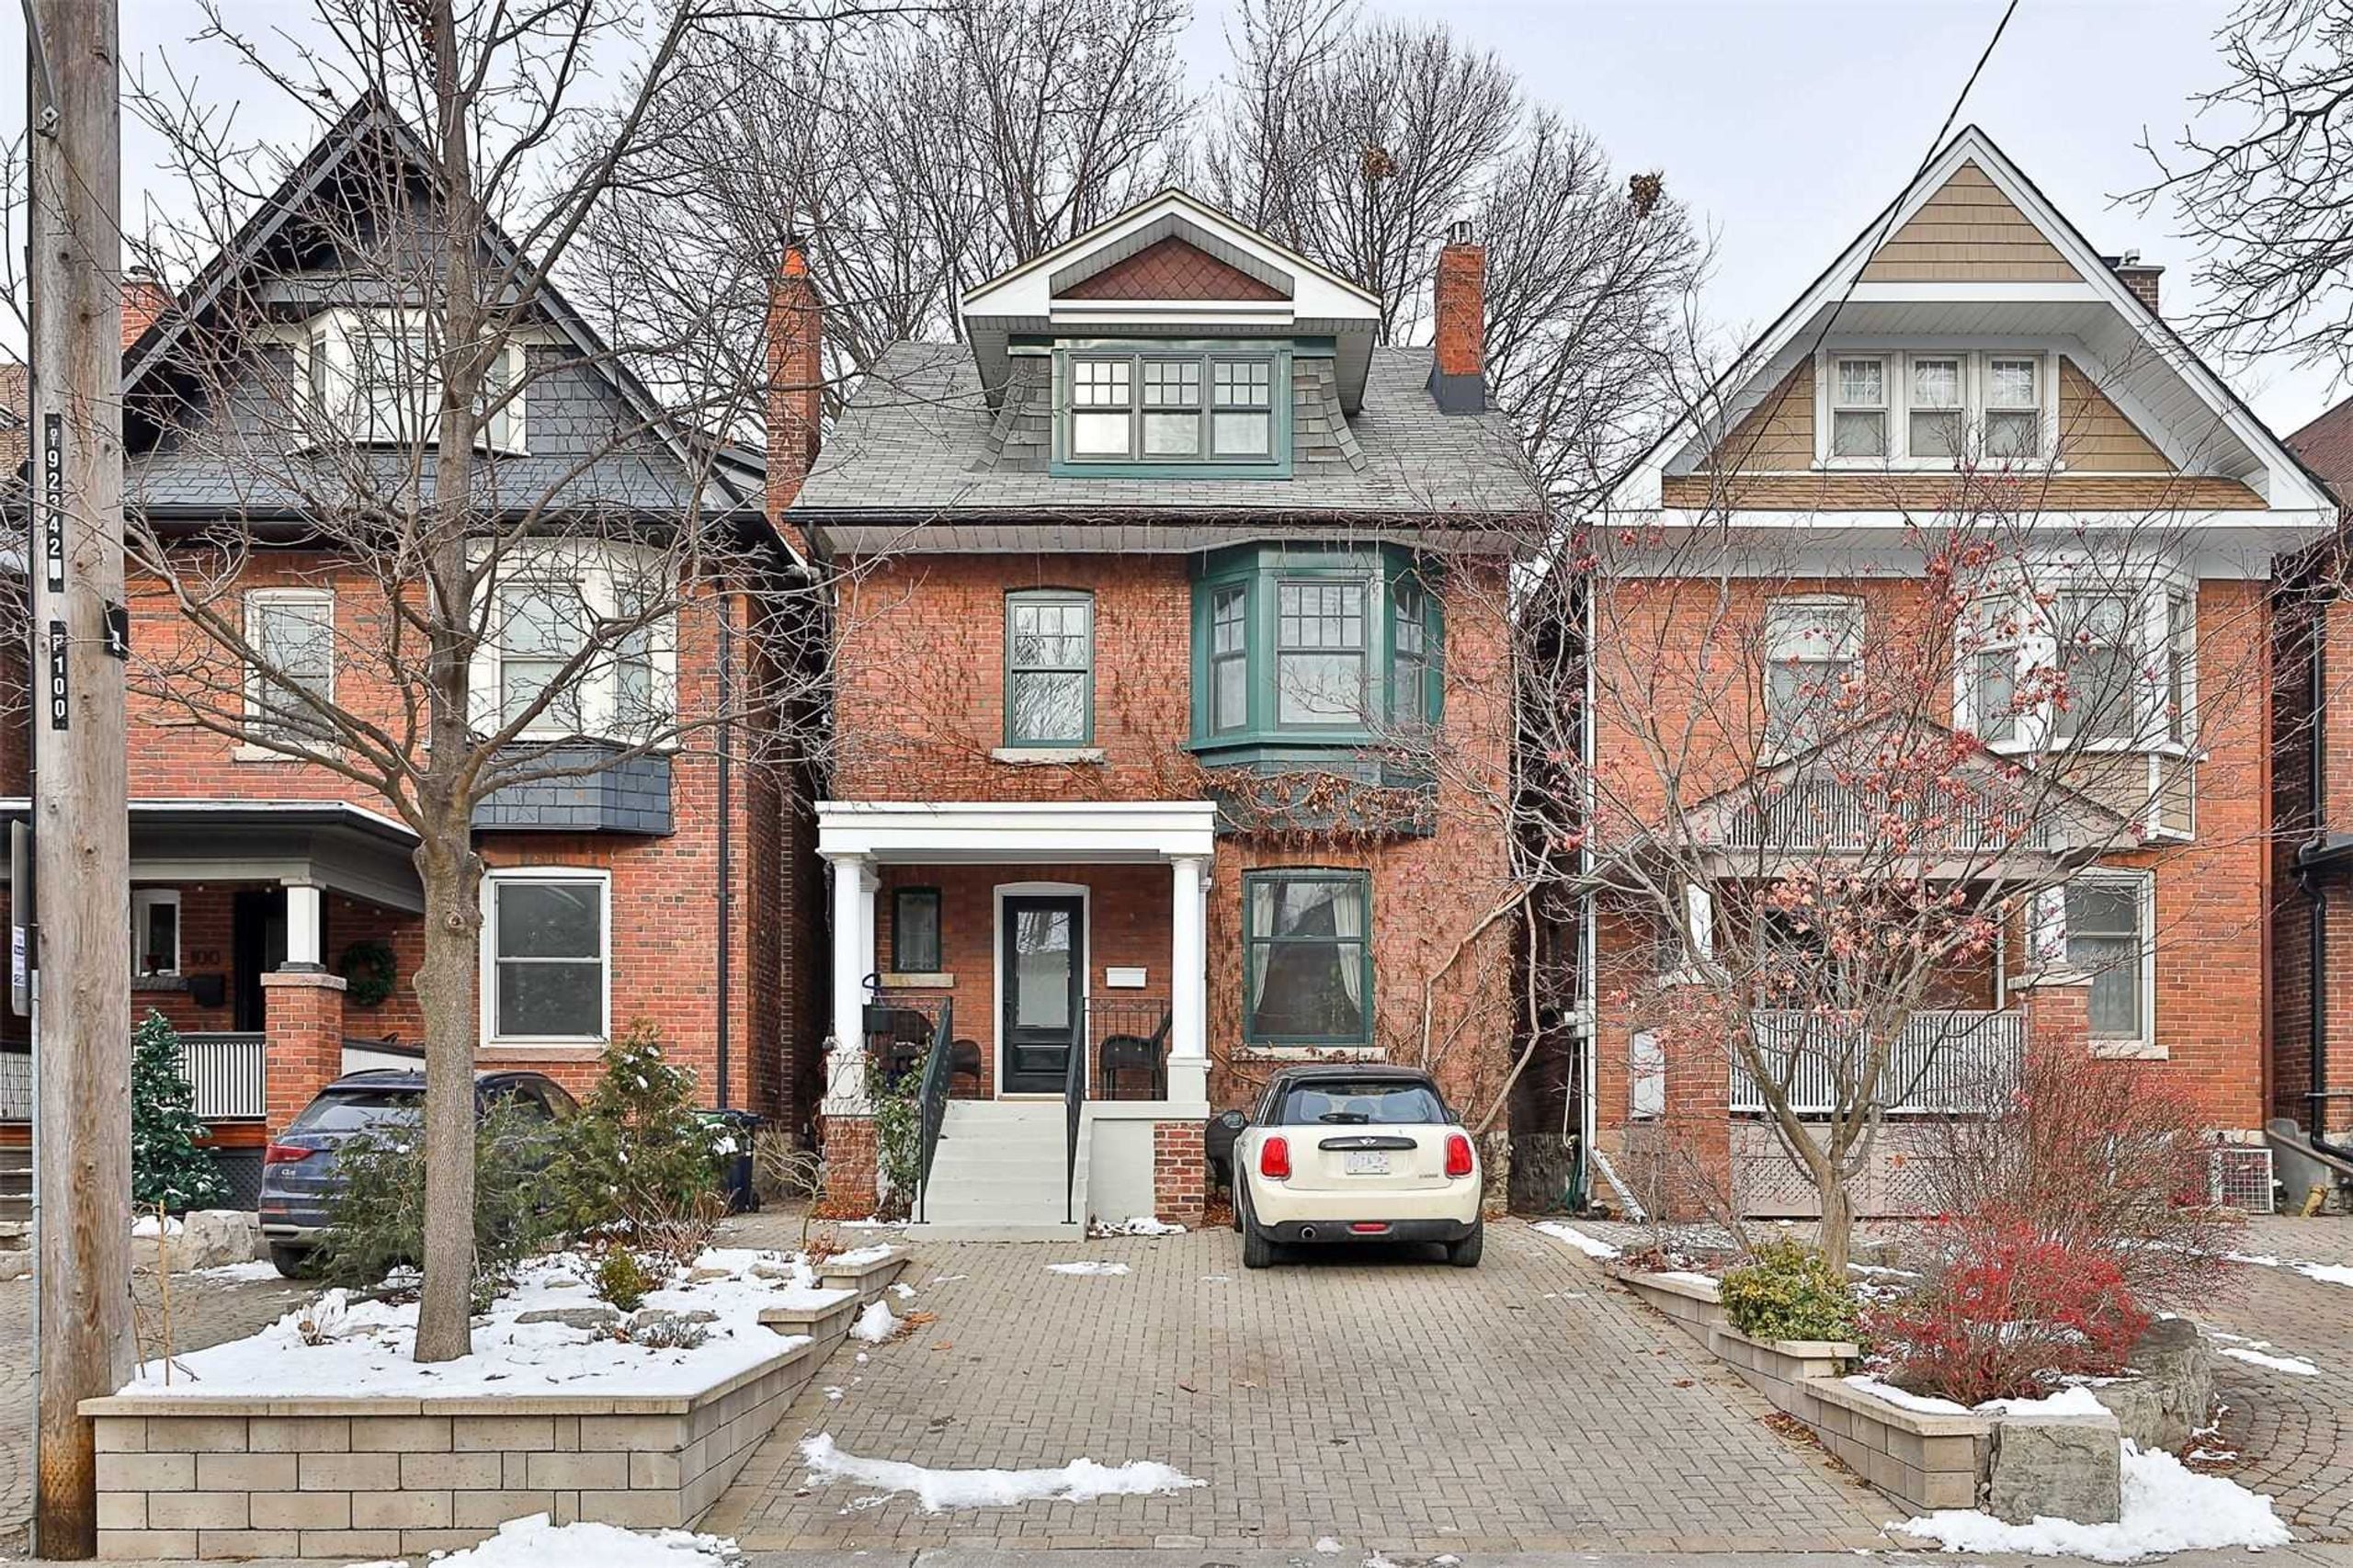
A typical Toronto core semi-detached — the most competitive freehold segment in March 2026.
Benchmark Price — Freehold
The median sale price for detached and semi-detached homes in Toronto came in at $1,277,500 in March 2026 — down from $1,339,500 in March 2025 and well below the peak of $1,549,000 reached in March 2022. As the chart below shows, we are in a structural correction from that peak, though the pace of decline has moderated significantly. Detached homes have absorbed the most pressure, while semi-detached properties in walkable core neighbourhoods have shown more resilience due to their relative affordability within the freehold category.

Source: TRREB data. March yearly comparison — Detached & Semi-Detached, Toronto. All figures current as of March 2026.
| Property Type | Median Price (Mar 2026) | Median Price (Mar 2025) | Avg. DOM |
|---|---|---|---|
| Detached — Toronto | ~$1,320,000 | ~$1,380,000 | 28 days |
| Semi-Detached | ~$1,185,000 | ~$1,210,000 | 24 days |
| Condo Townhouse | ~$720,000 | ~$750,000 | 26 days |
| Condo Apartment | ~$575,000 | ~$610,000 | 30 days |
Source: TRREB median sale price by property type. Toronto all neighbourhoods, March 2026.
Rental Market — Toronto Core Condos
The condo rental market in Toronto's core showed continued softening in March 2026, with average rents declining modestly year-over-year as supply from purpose-built rentals and investor-owned condos kept vacancy rates above historical norms. Tenants have more options and more negotiating power than at any point since 2020.
1-Bedroom Condo Rentals
The average rent for a one-bedroom condo in the Toronto core landed at $2,290/month in March 2026 — down 5.1% from $2,413 in March 2025. This is the sharpest year-over-year decline in the one-bedroom segment since the pandemic correction of 2020. The softening is concentrated in buildings with high investor ownership ratios and lower walk scores, where multiple identical units have flooded the market simultaneously.
Well-located one-bedrooms — within a short walk of a subway station in King West, Yorkville, or the Financial District — are still leasing in the $2,450–$2,700 range and seeing demand within the first week of listing. The discount is in the secondary corridors.
2-Bedroom Condo Rentals
Two-bedroom units averaged $3,080/month, a decline of 4.4% year-over-year. Two-bedrooms have shown slightly better resilience than one-bedrooms because they appeal to a wider tenant pool — couples, roommates, and young families who find purpose-built rental buildings lacking in unit size. Units with two full bathrooms and a functional split layout command a meaningful premium, often achieving $3,300–$3,600/month in premium buildings.
| Unit Type | Avg. Rent (Mar 2026) | Avg. Rent (Mar 2025) | Change | Avg. Days to Lease |
|---|---|---|---|---|
| Studio / Bachelor | $1,820 | $1,940 | ↓ 6.2% | 28 days |
| 1 Bedroom | $2,290 | $2,413 | ↓ 5.1% | 22 days |
| 1 Bed + Den | $2,580 | $2,690 | ↓ 4.1% | 20 days |
| 2 Bedroom | $3,080 | $3,222 | ↓ 4.4% | 18 days |
| 2 Bed + Den | $3,490 | $3,590 | ↓ 2.8% | 15 days |
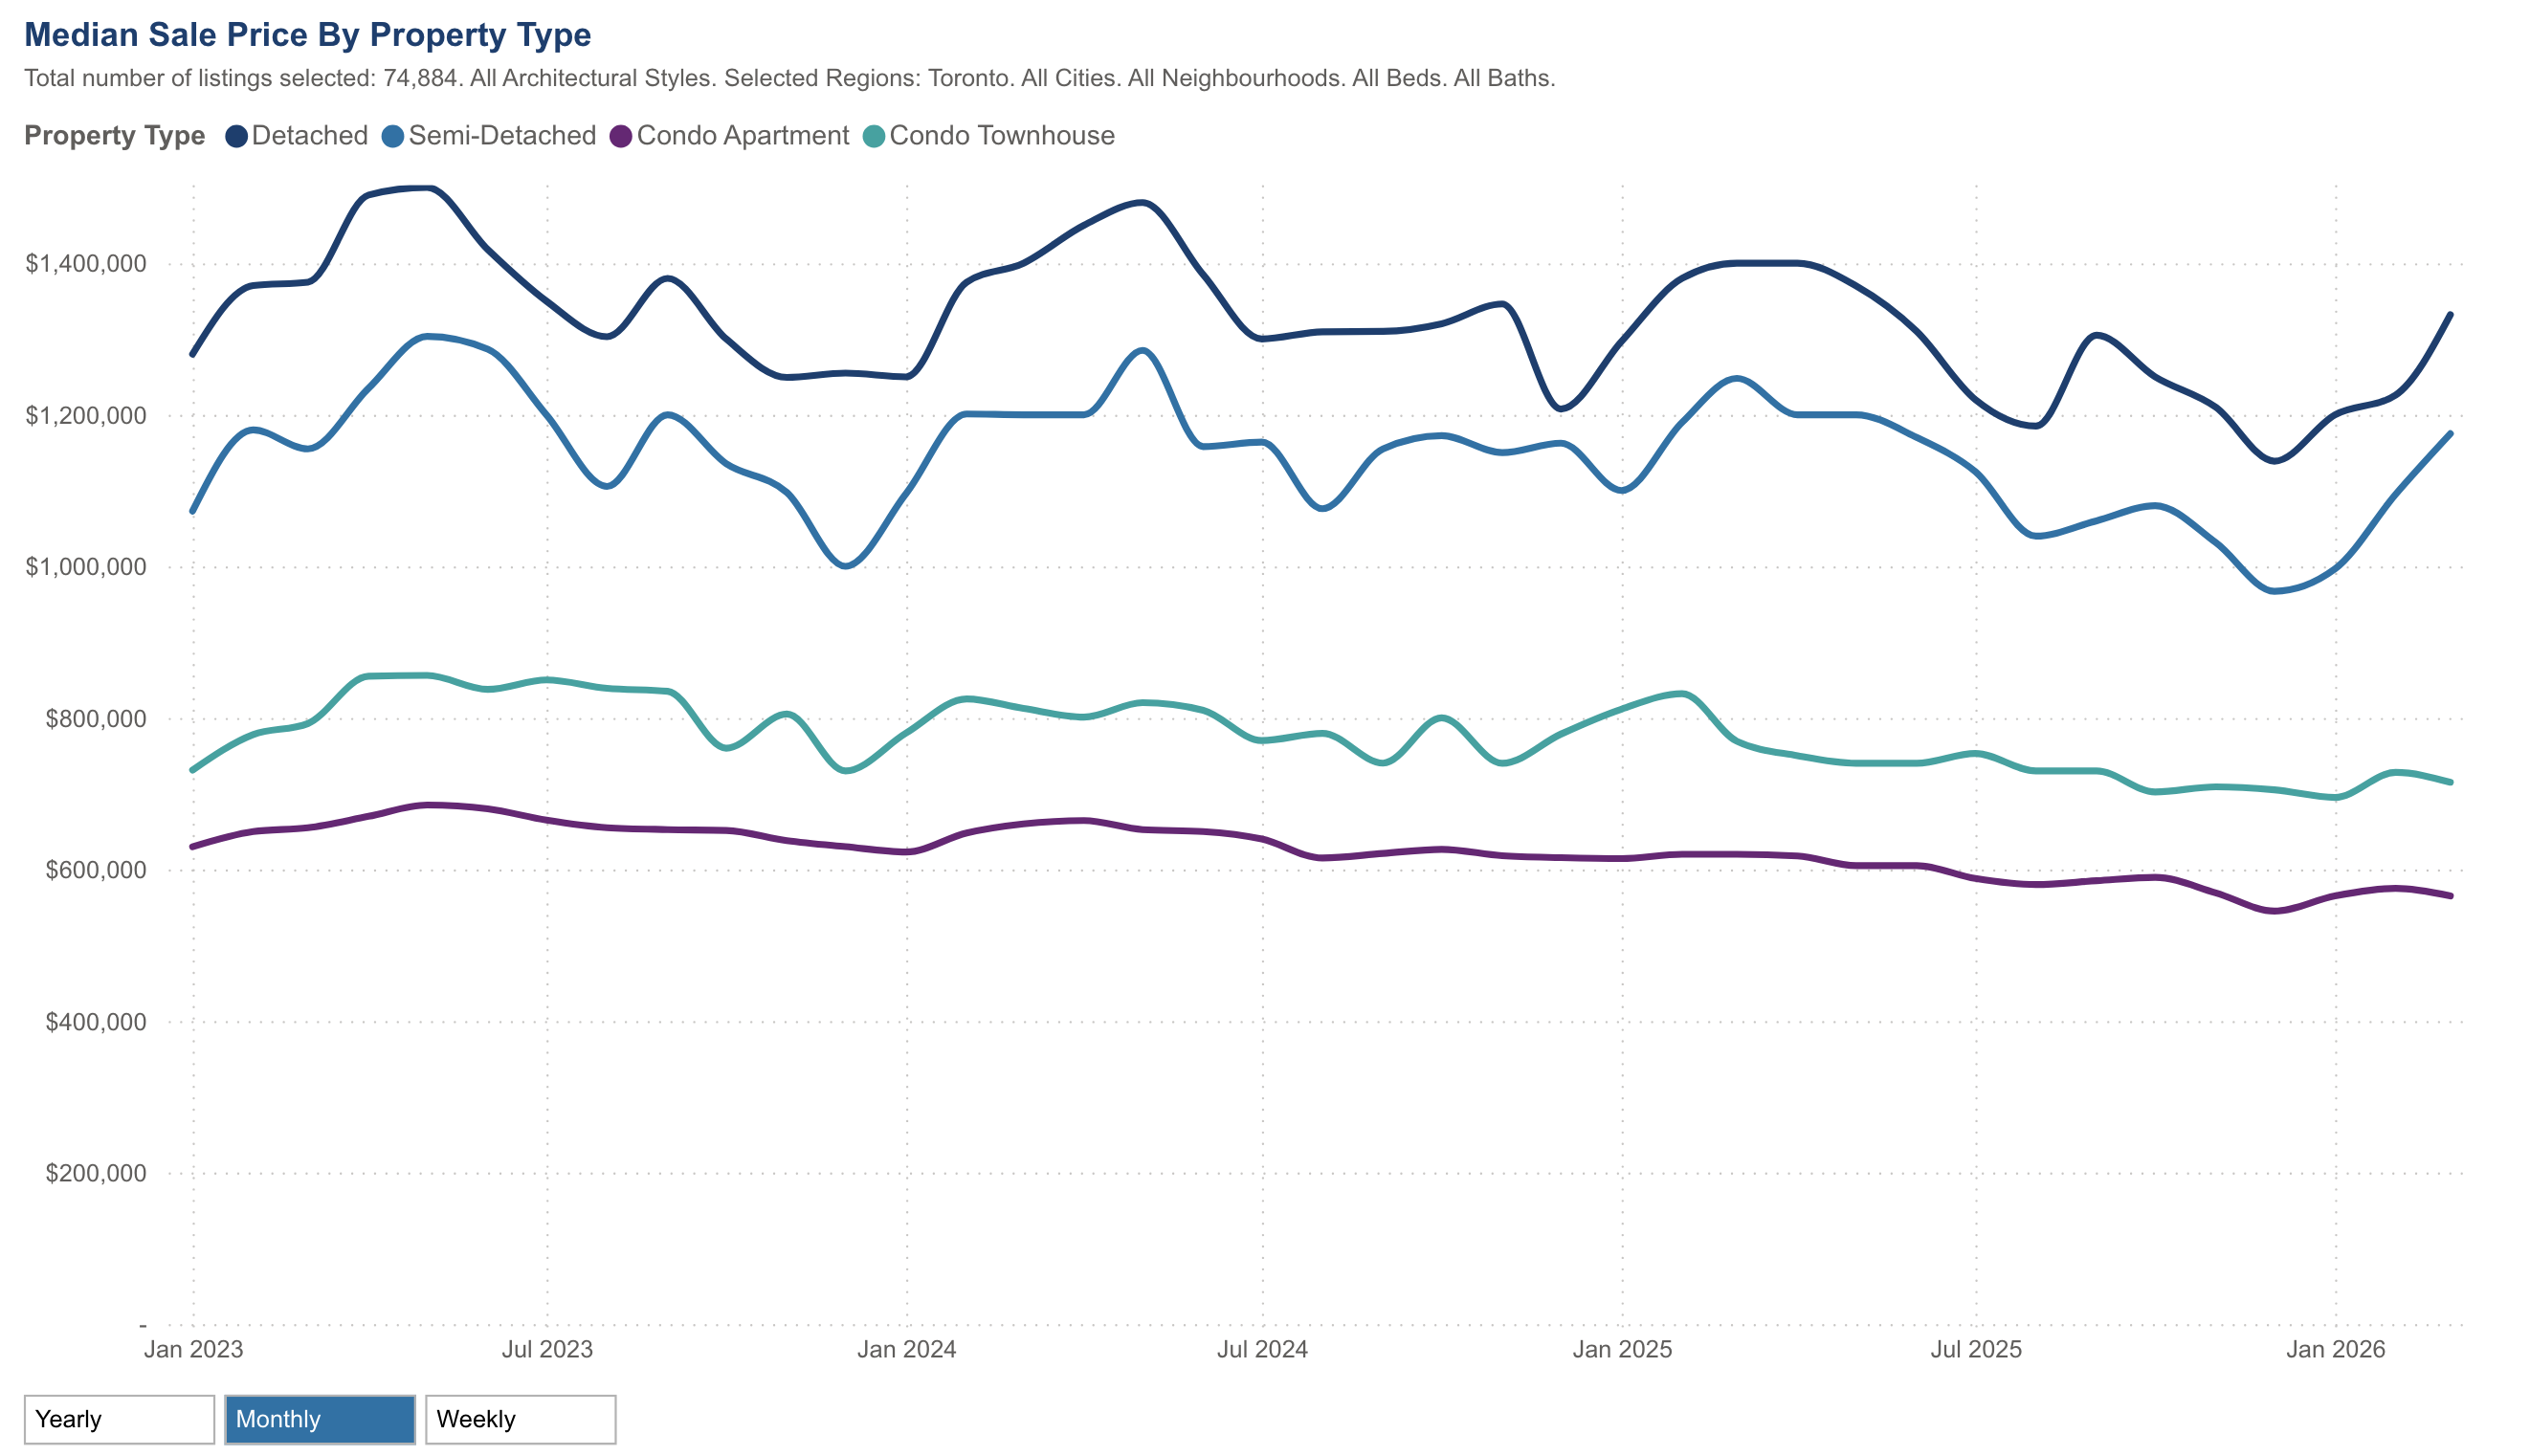
Median sale price by property type, Jan 2023 – Mar 2026. Source: TRREB. Detached (dark blue), Semi-Detached (blue), Condo Townhouse (teal), Condo Apartment (purple).
Rental Activity — Condo vs. Detached
Condo rental activity remains the dominant segment of the Toronto rental market by volume, accounting for roughly 78% of all lease transactions in the core. However, activity has cooled noticeably relative to 2024: total condo lease transactions in March 2026 were down approximately 8% year-over-year, reflecting both softer demand from new arrivals (immigration intake moderation in late 2025) and increased supply from new completions in the CityPlace, Liberty Village, and Regent Park corridors.
Detached home rentals — a niche but meaningful segment for families seeking more space — remained relatively stable in March 2026. The average monthly rent for a detached home in the Toronto core sits at approximately $4,800–$6,200/month, depending heavily on size, location, and whether the basement is included. Detached rental supply remains constrained because most owners prefer to sell than lease at current carrying costs, which tends to keep the detached rental market tighter than the condo segment.
| Rental Segment | Lease Transactions (Mar 2026) | YoY Change | Avg. Rent Range |
|---|---|---|---|
| Condo Apartments | 2,840 | ↓ 8.3% | $1,820–$3,490+ |
| Condo Townhouse | 312 | ↓ 4.1% | $3,100–$4,200 |
| Semi-Detached | 148 | ↑ 2.7% | $3,600–$4,800 |
| Detached | 94 | ↑ 5.3% | $4,800–$6,200+ |
April 2026 Outlook
The charts tell a clear story: Toronto's freehold market has been in a steady, measured correction since the March 2022 peak of $1,549,000. Four years later, the median has settled at $1,277,500 — an 18% pullback that has reset affordability without triggering the kind of distressed selling seen in previous downturns. Transaction volume at 762 sales is the lowest March reading since 2018, and with MOI at 3.31 and rising, the weight of inventory is keeping a lid on any recovery in prices.
For the condo market, the median price chart confirms what buyers already feel on the ground: the condo apartment median has declined from $745,000 at the March 2022 peak to $565,000 in March 2026 — a 24% correction over four years. Transaction volume at 973 sales is less than a third of the 2,995 peak, and with 4,872 active listings and MOI at 5.05, the inventory overhang is substantial. The condo townhouse segment has shown more resilience, trading closer to $720,000 and attracting end-users who want more space without a full freehold price tag.
Heading into spring, the key question is whether transaction volume recovers. The Bank of Canada's rate path and US tariff uncertainty are the two wildcards. If volume picks up toward 900+ sales in April, expect prices to stabilize. If volume stays flat or falls, inventory will continue to build and further price softening is the base case for both segments.
Want a data-driven strategy for your move?
Whether you're buying, renting, or selling — your next step deserves a proper plan. Let's talk.
Get Your Strategy →